Contents
The Ultimate Guide to Project Dashboard
By Pratik ShindeMar 20, 2022
Do you remember Tony Stark's JARVIS—a natural-language user interface computer system—used in Iron Man and other Avenger movies?
Yes, the one with which Tony Stark visualizes and monitors the progress of his ongoing projects at his fingertips.
When it comes to monitoring and analyzing projects, you wish to have such an intelligent system to keep track of your projects, and that’s where project dashboards come into the picture.
But, what exactly is a project management dashboard, and how can you use one to organize your projects?
What is a Project Management Dashboard?
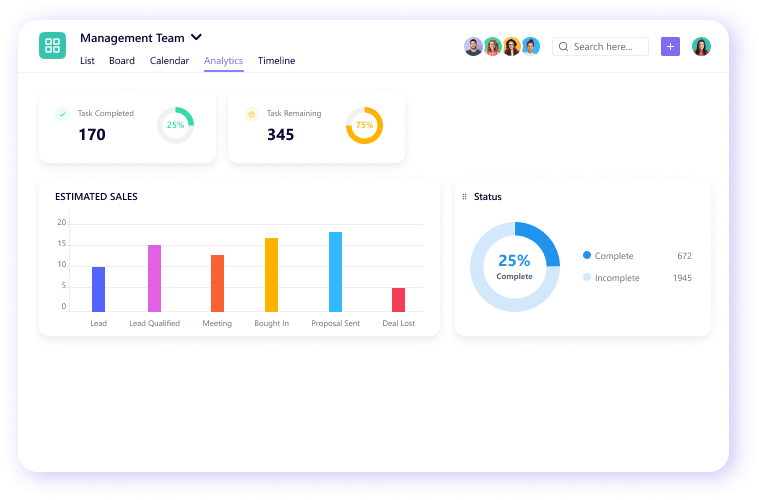
A project management dashboard is a data dashboard designed to display metrics, stats, insights, and key performance indicators related to specific projects at one central location.
It is a single interface that helps you visualize, monitor, optimize, and enhance the performance of your projects.
It serves as a real-time monitoring tool for all your projects so that you can decide what’s working, what’s not, and what changes need to be done to achieve your goals.
To sum it up, A project management dashboard gives you a big picture of how all your projects are doing.
Everything is available at your fingertips, just like Tony.

It is suitable for project managers, teams, individual departments, and anyone who is looking to monitor their projects.
Let’s dive a little deeper to understand all the project dashboards you would need to monitor your projects.
Types of Project Management Dashboards
One size fits for all approach never works with project dashboards. In fact, an ideal project dashboard should be customizable according to the needs and challenges of your projects. SmartTask offers five customizable views to create dashboards for your projects. Let’s review each view one by one.
1. Project Portfolio View
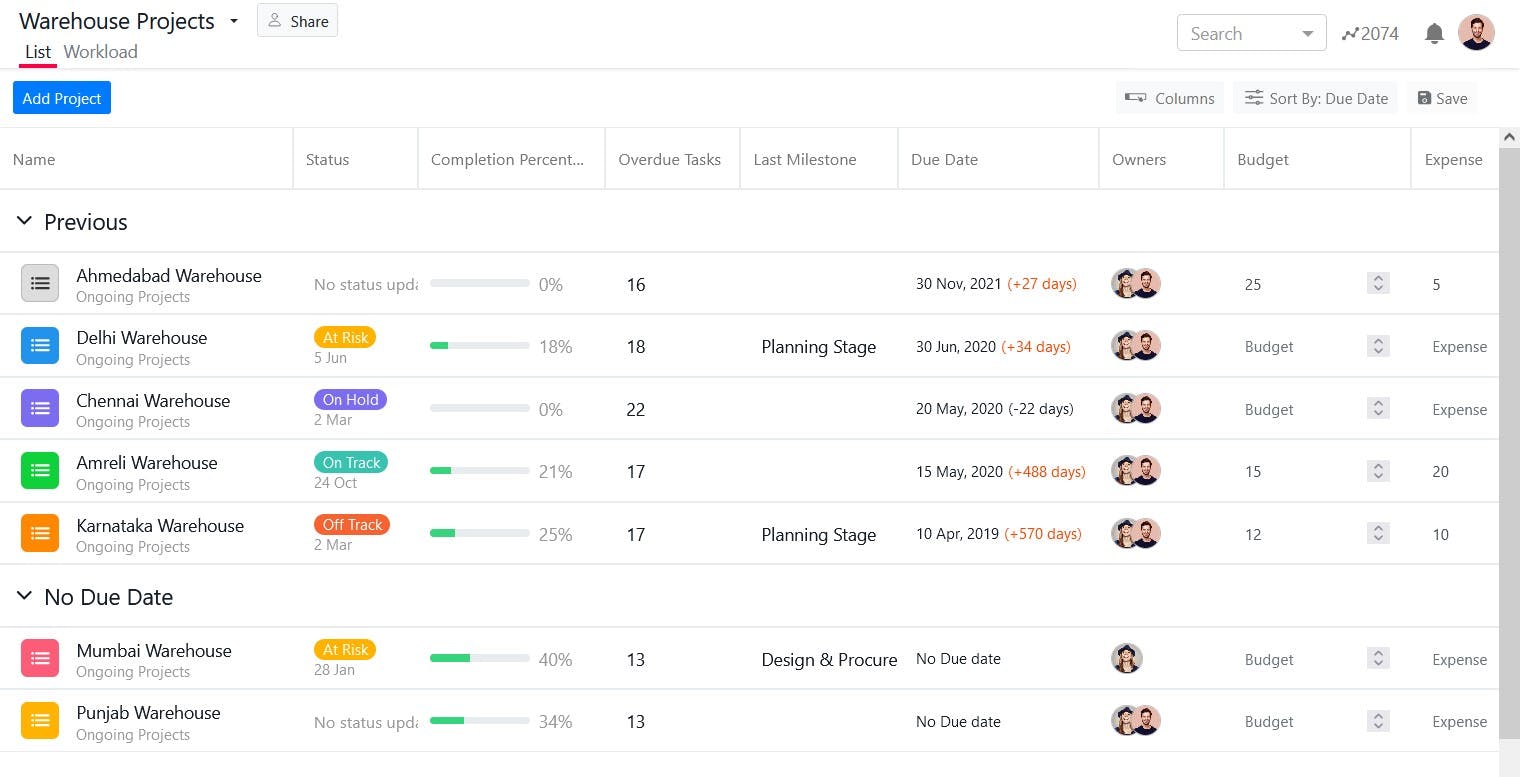
The project portfolio view allows you to manage multiple projects in one place. For example, you can track a project’s status, milestones, overdue tasks, due dates, predicted completion, and deviance, all at one location for multiple projects.
You can track the following details with the project portfolio view:
- Status - It displays the current status of your projects. For example, you can identify whether your projects are on track, off track, on hold, or at risk.
- Completion Percentage - It’s a horizontal bar that shows the project’s progress in percentage completed. You can monitor at a glance how your projects are doing in real-time.
- Last Milestone Status - It displays the last milestone the project has reached. It helps you accurately track where your project is in its life cycle.
- Overdue Tasks - It shows you the number of overdue or incomplete tasks in different projects.
- Due Date - It displays the project's due date, predicted completion date, and deviance.
- Owners - It shows the team members responsible for various projects.
The project portfolio view is not limited by these features. You can also add custom columns depending upon the needs of your projects.
2. Workload View
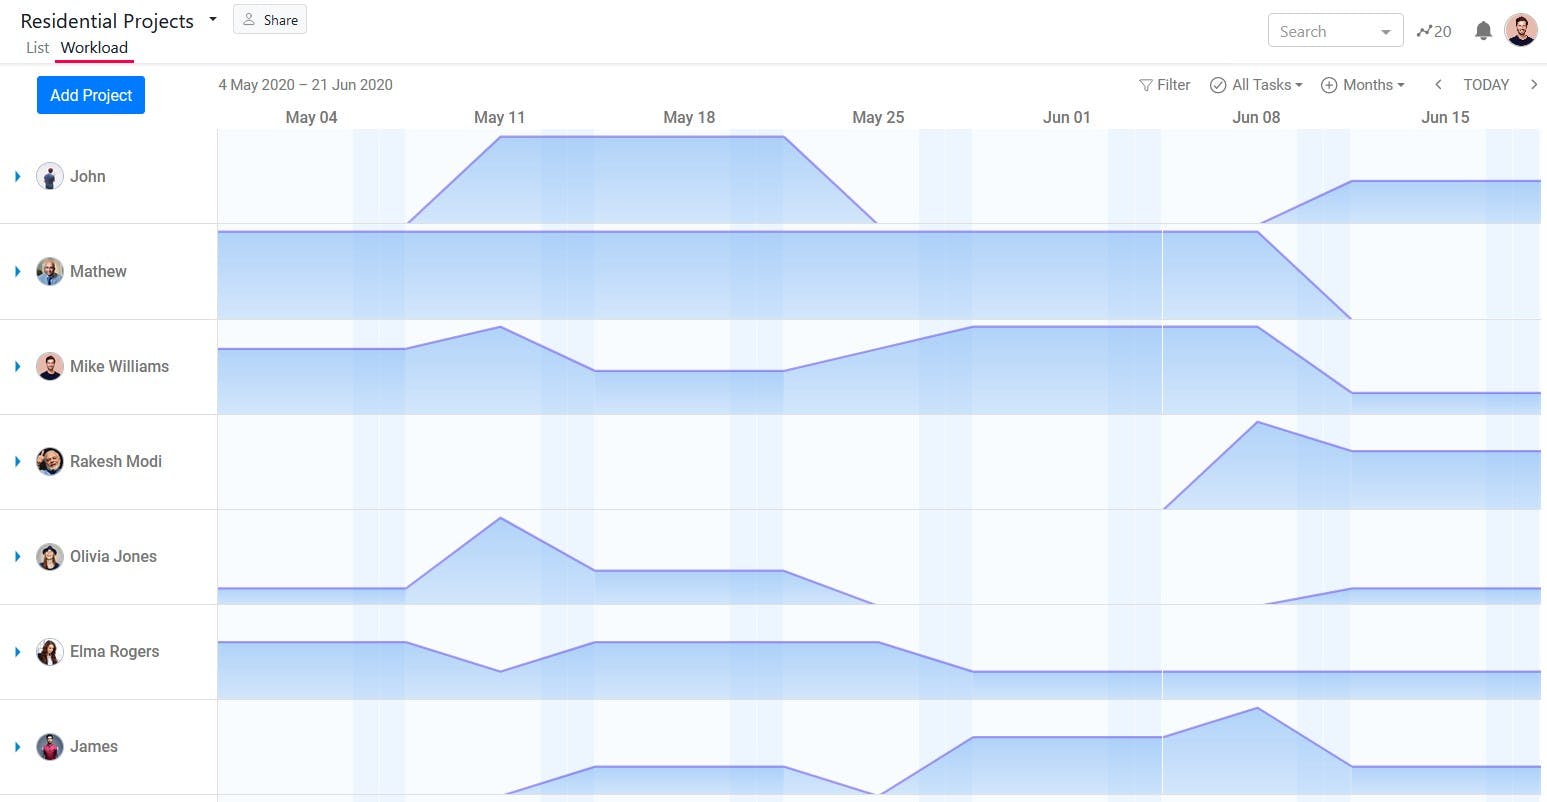
The workload view helps you in resource allocation. You can monitor the workload of each team member and reallocate tasks to balance the workload. You can also view each member’s tasks with start and end dates.
3. Project Analytics View
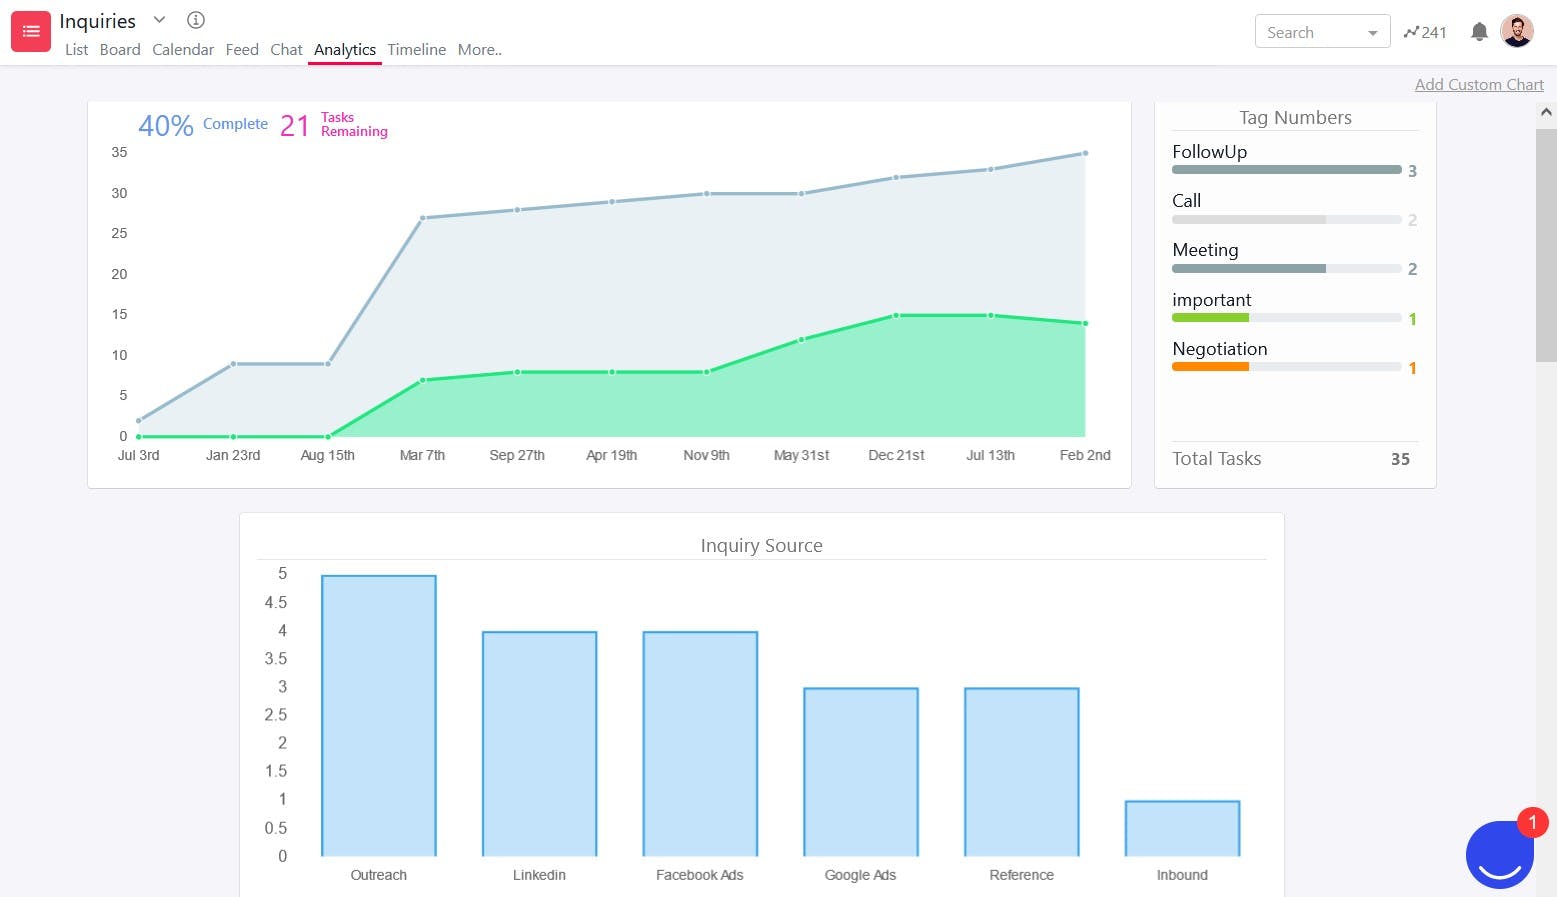
The project analytics view allows you to monitor the progress of a particular project in real-time. By default, It displays task analytics with the line chart. It also allows you to create custom charts based on the requirements of your projects as shown in the image below.
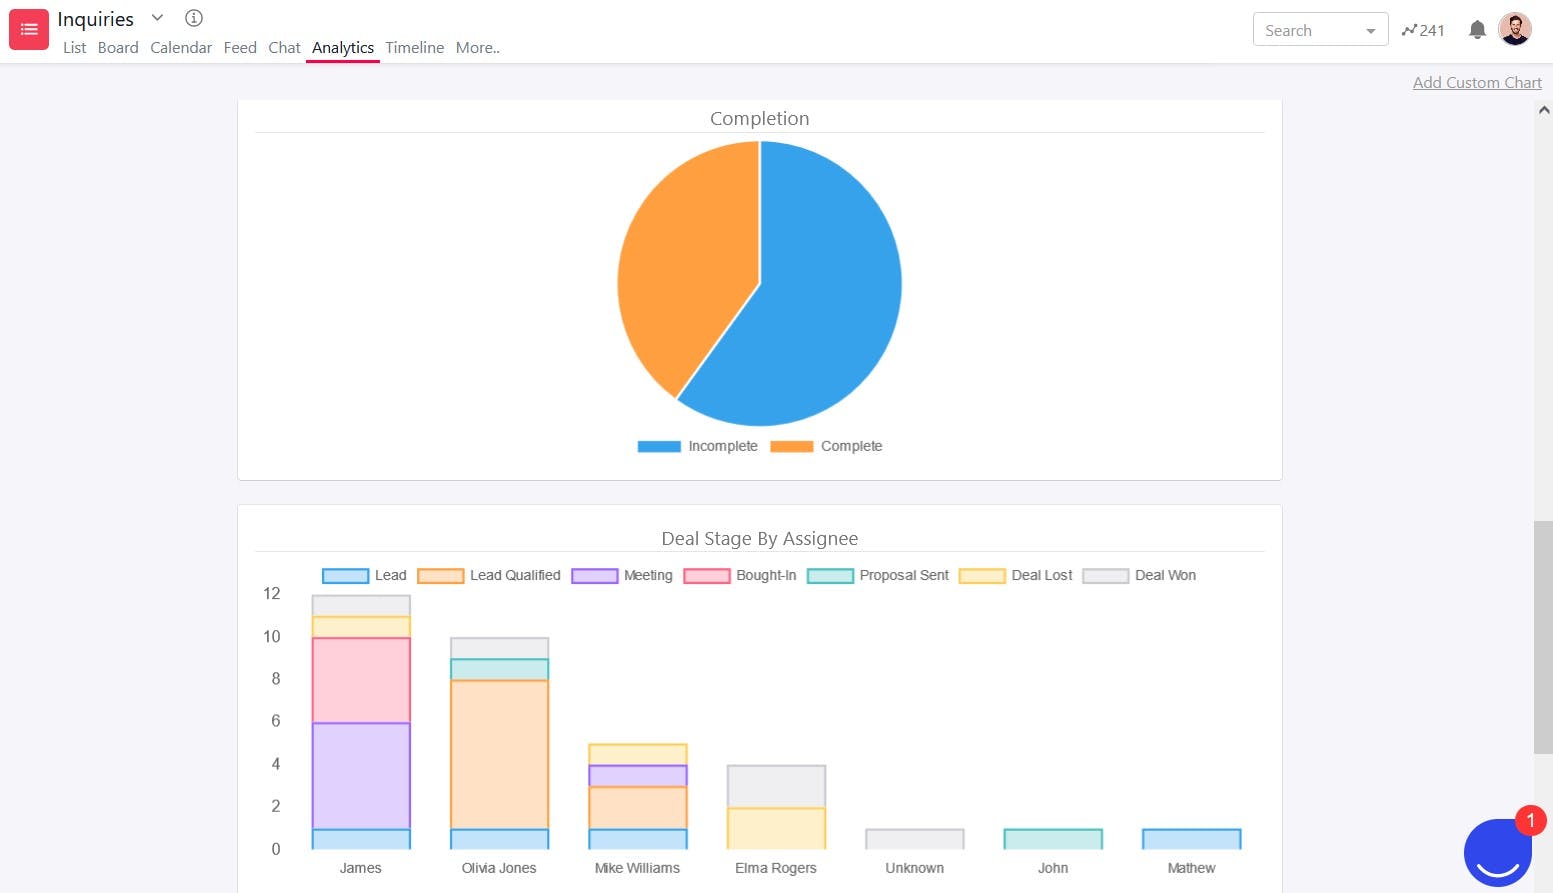
You can create a custom bar, line, or pie chart and save it in the project analytics view. It also allows you to group multiple variables in a single chart.
The project analytics view updates in real-time as your team completes their tasks.
4. Global Analytics View
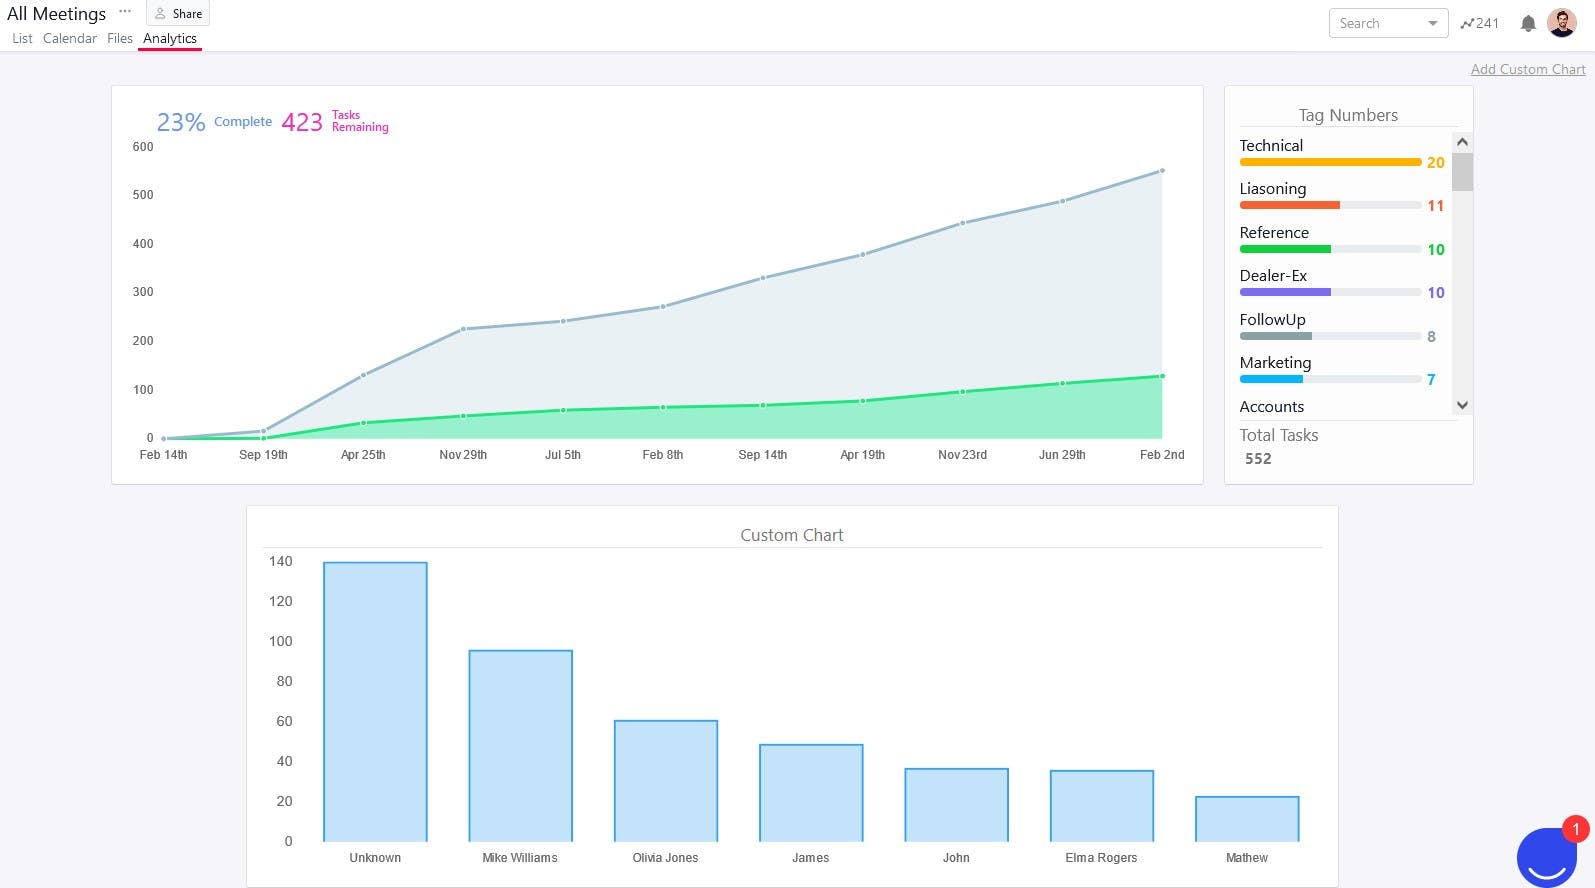
The global analytics view looks similar to the project analytics view. But the only difference is that the project analytics view gives you project-level updates of tasks and the global analytics view gives you the overall updates of tasks across the organization.
The advanced search feature in SmartTask allows you to filter out tasks across the organization the way you want. There are multiple filter options available. You can save these task filtered views and see analytics for these views at a global level.
The global analytics view also allows you to create and save custom charts as per the requirements of your organization and get real-time updates.
5. Time Tracking Analytics View
You can track time on tasks with the time tracking feature in SmartTask. The time tracking analytics view displays the total estimated time, reported time, and who spend how much time on a particular project. You can also view the cost and billable amount.
Now let’s take a look at how you can create a project status dashboard with SmartTask.
How to create a Project Status Dashboard with SmartTask?
The project portfolio view in SmartTask helps you organize multiple projects and offer you real-time monitoring. Now let me walk you step by step on how you can build a project status dashboard in SmartTask.
But Hey! To follow these steps along with me, you must log in to SmartTask first.
In case you haven’t signed up yet, I’m highly recommending you sign up first.
Just do it. It only takes 15 seconds or something, and it is totally free.
You can also take a look at a quick start guide to get familiarized with SmartTask (Just a matter of 15 to 20 minutes).
Alright! Now I’m assuming that you are logged in to SmartTask. So let’s move further:
1. Add projects in SmartTask
- To create a project dashboard in SmartTask, you first need to create projects and add/import tasks into these projects.
- Once you are ready with your projects, you can move on to the next step of creating a portfolio.
2. Create a Portfolio
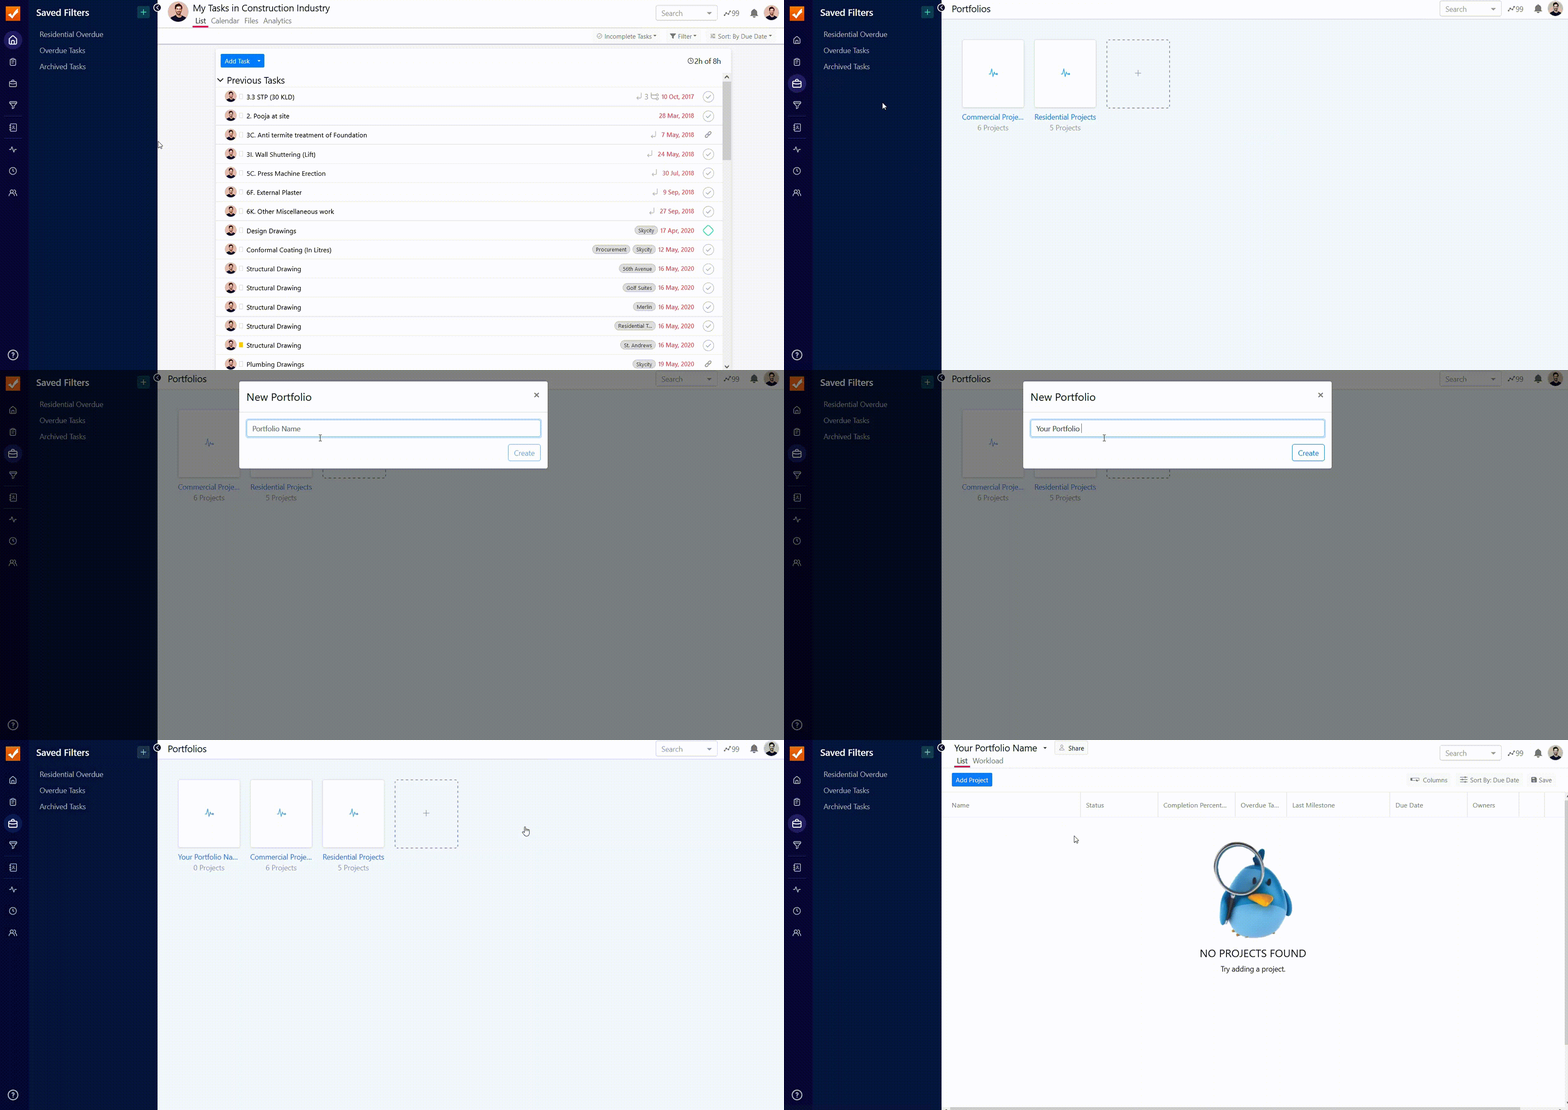
- Click on the Portfolios field on the top left sidebar.
- Click on Create Portfolio.
- Provide Portfolio name.
3. Add Projects to the Portfolio
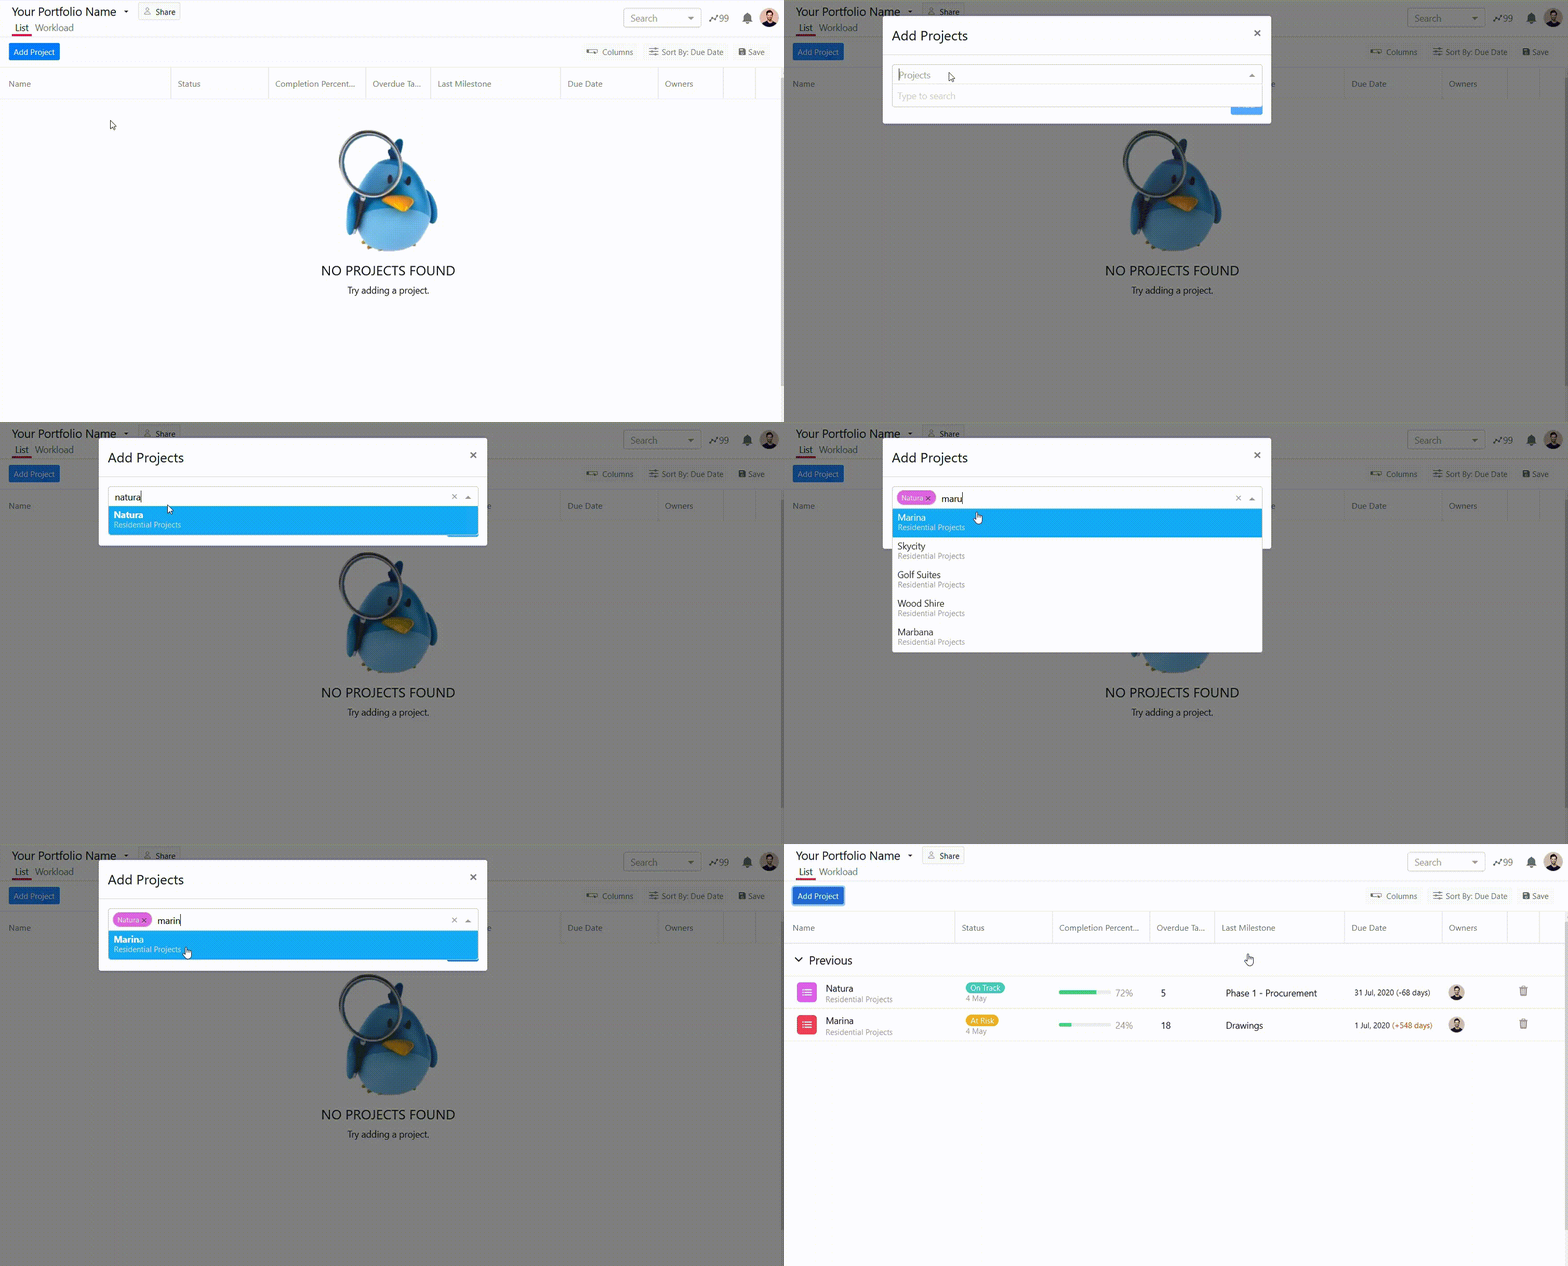
- Click on Add Project.
- Search the project name.
- Click Add.
4. Share Portfolio

- Click on the Dropdown option next to your Portfolio name.
- Select Share with members.
- Search and select the Member’s name.
- Click Add to Group.
Great! It’s that easy.
Now you are able to create your own project status dashboard with SmartTask in seconds and share them with your teammates.
Thumbs up from Tony!

But wait, there is one more cool feature that we haven’t discussed yet. You have a portfolio of projects in front of you. Now it’s time to generate reports, and analyze your project’s progress in Google Sheets.
How to create a real-time Project Dashboard in Google Sheets?
Creating a live project dashboard in Google Sheets with SmartTask is as easy as eating a piece of cake.
SmartTask’s Google Sheets integration allows you to get an immediate overview of multiple projects, generate reports, and analyze the project’s progress. Let’s see how exactly it works.
If you are following me along the way, I’m assuming that you might have added your projects in SmartTask by now and created a portfolio that might look like the example shown below.
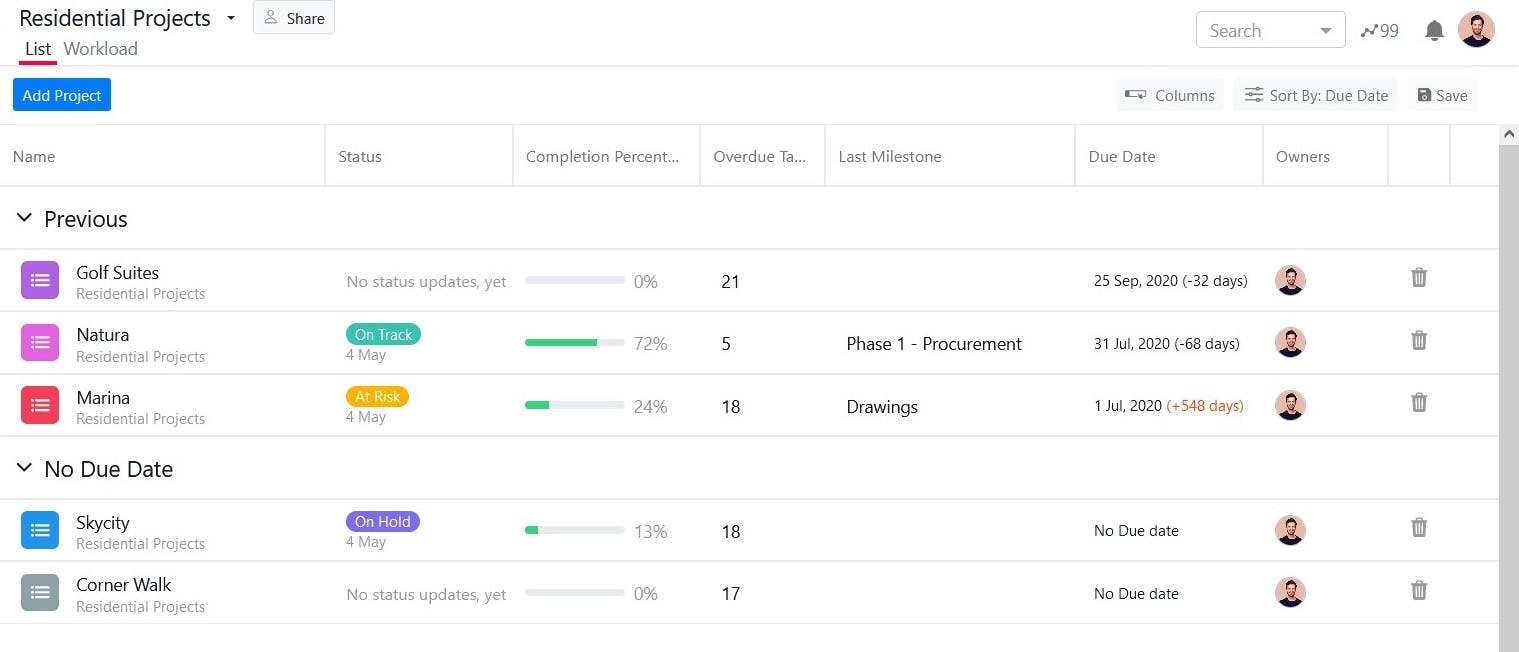
Now let me show you step by step, how to create a live project dashboard and generate reports using Google Sheets:
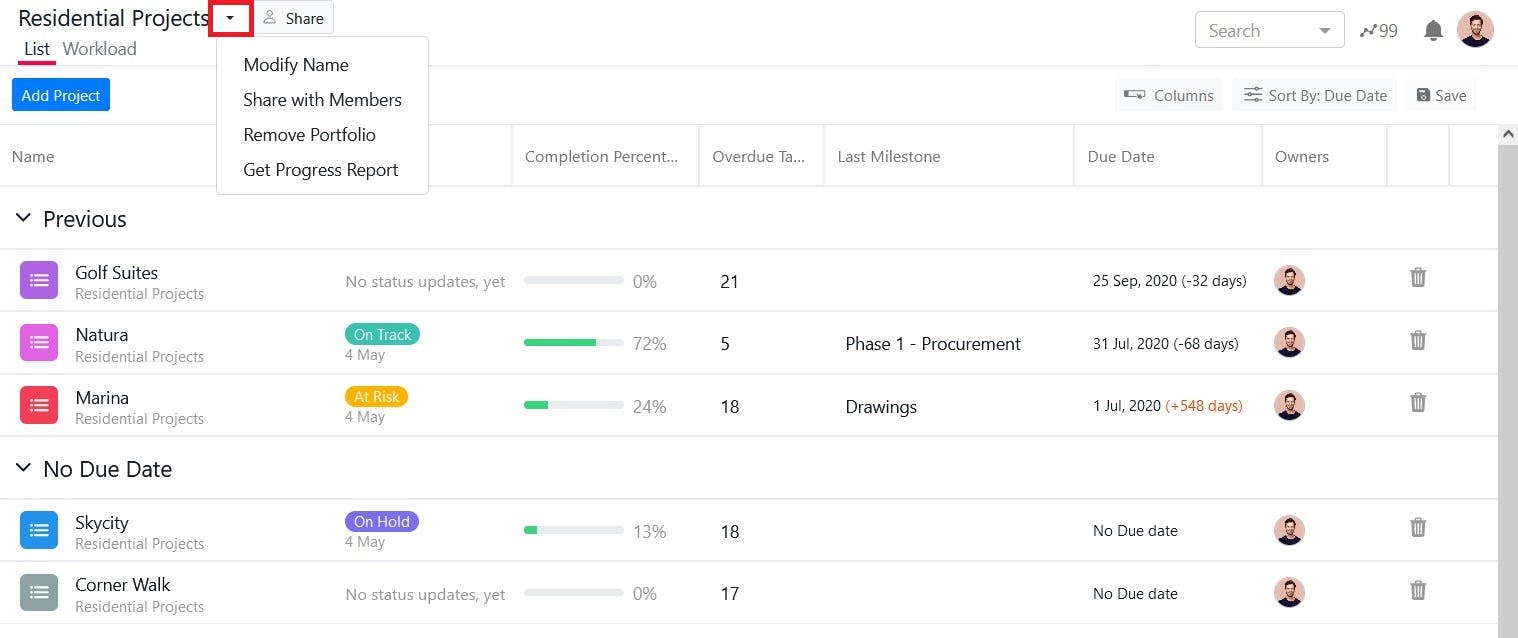
1. Click the Dropdown next to the Portfolio Name
Click the dropdown button next to the Portfolio name in the top left corner of the screen. In my case, It is Residential Projects as shown in the image below.
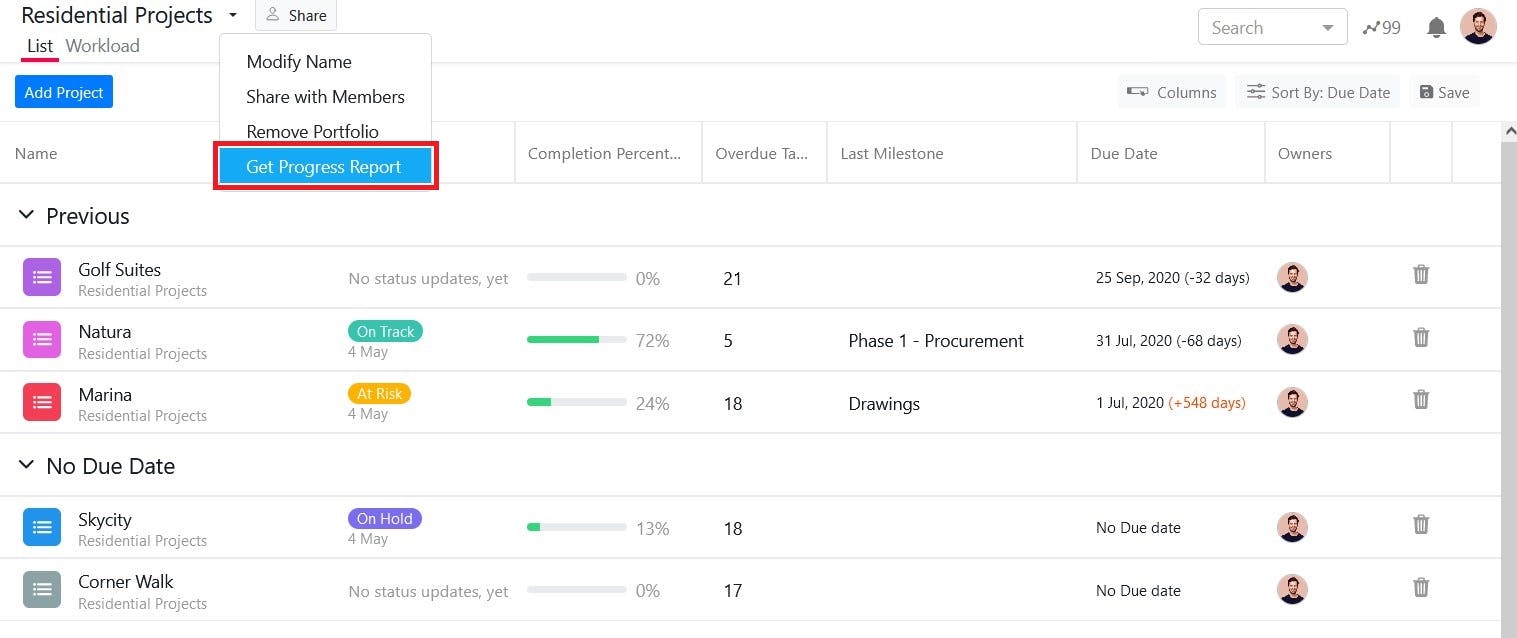
2. Select the Get Progress Report Option
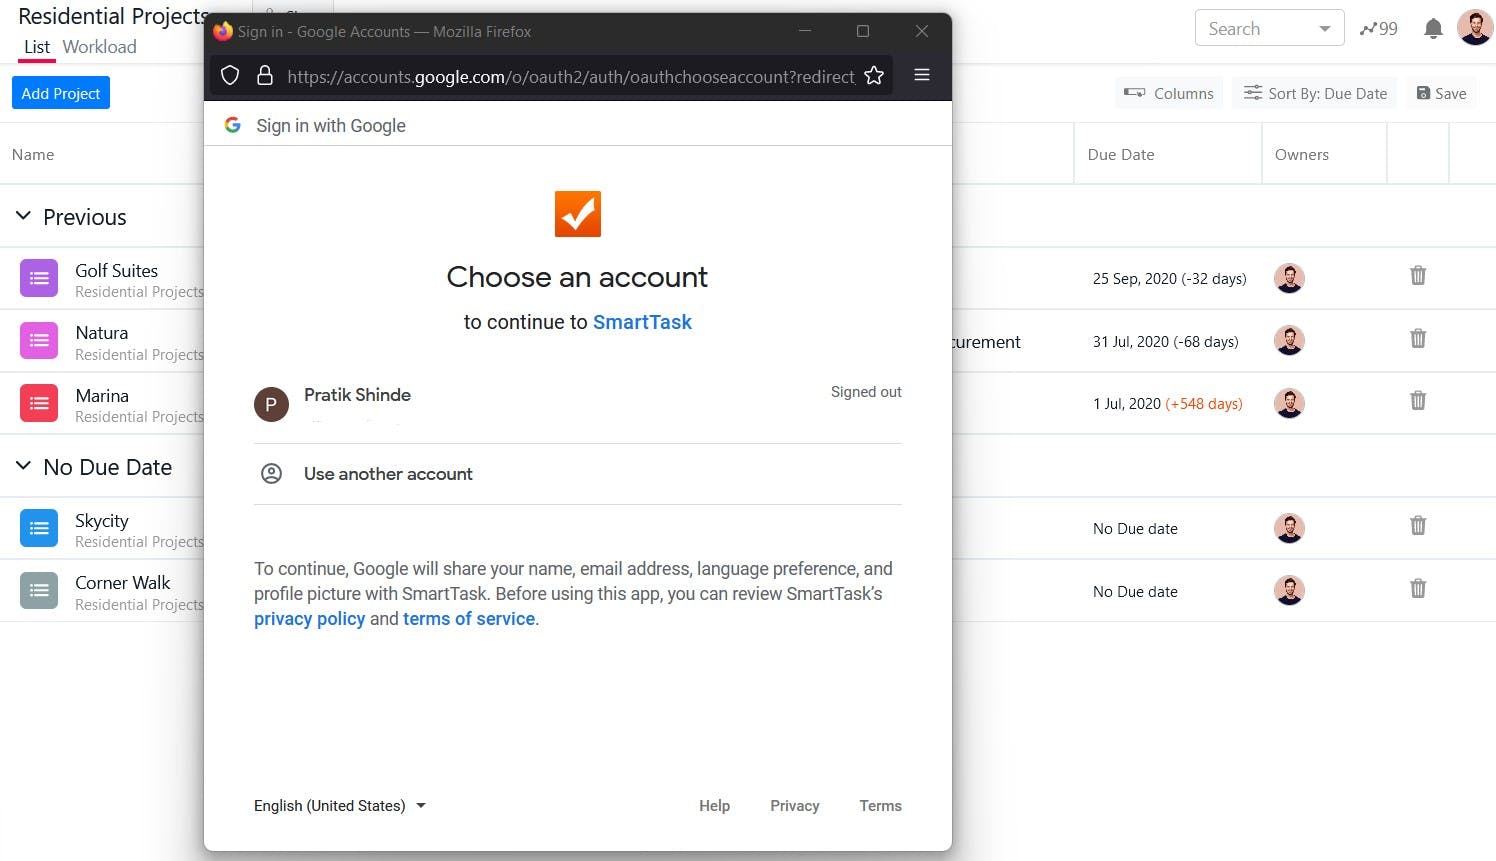
3. Select your Google Account
You need to allow SmartTask permission to view and manage your spreadsheets in Google Drive.
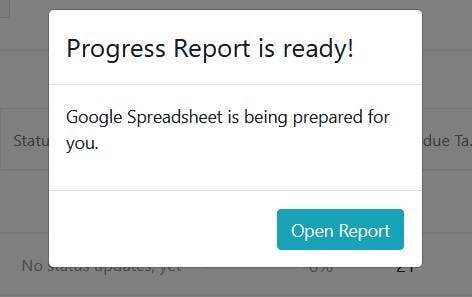
4. Click Open Report
A pop-up will open like the image shown below. Then click Open Report.
5. Google sheet with project overview will open in a new tab.
You will see the overview of all your projects in the bar chart and pie chart format. You can also create your own charts from the data in the other tabs.
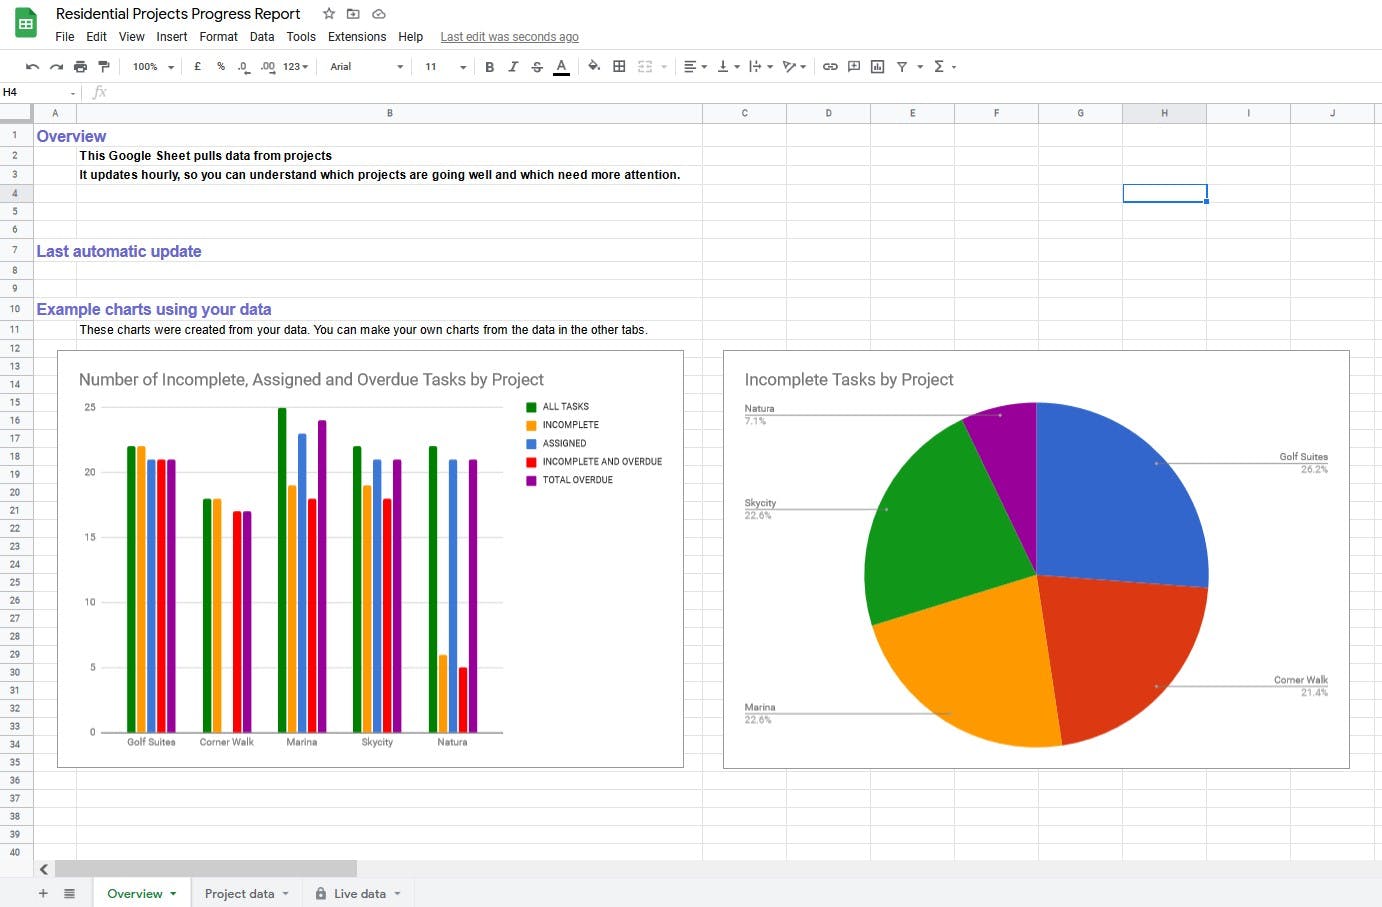
This Google Sheet pulls data from projects in real-time every hour. So you can understand which projects are going well and which need more attention.
You can also view project data as shown in the image below in the same spreadsheet.

That’s how you can create a real-time project dashboard and generate reports using Google Sheets integration with SmartTask in just a few clicks.
Boom! It’s that simple.
Now you are also able to create a dashboard, generate reports and analyze a project’s progress in real-time with Google Sheets.
Double thumbs up from Tony!

So far we talked about only Google Sheets integration, but there are many other coolest integrations available for SmartTask so that you can work with your favorite applications seamlessly.
Now let’s take a look at some real-life examples of the project management dashboards in SmartTask.
Project Dashboard Examples & Templates
Let me show you how project management dashboards look like in SmartTask for various use cases.
1. IT Project Management Dashboard
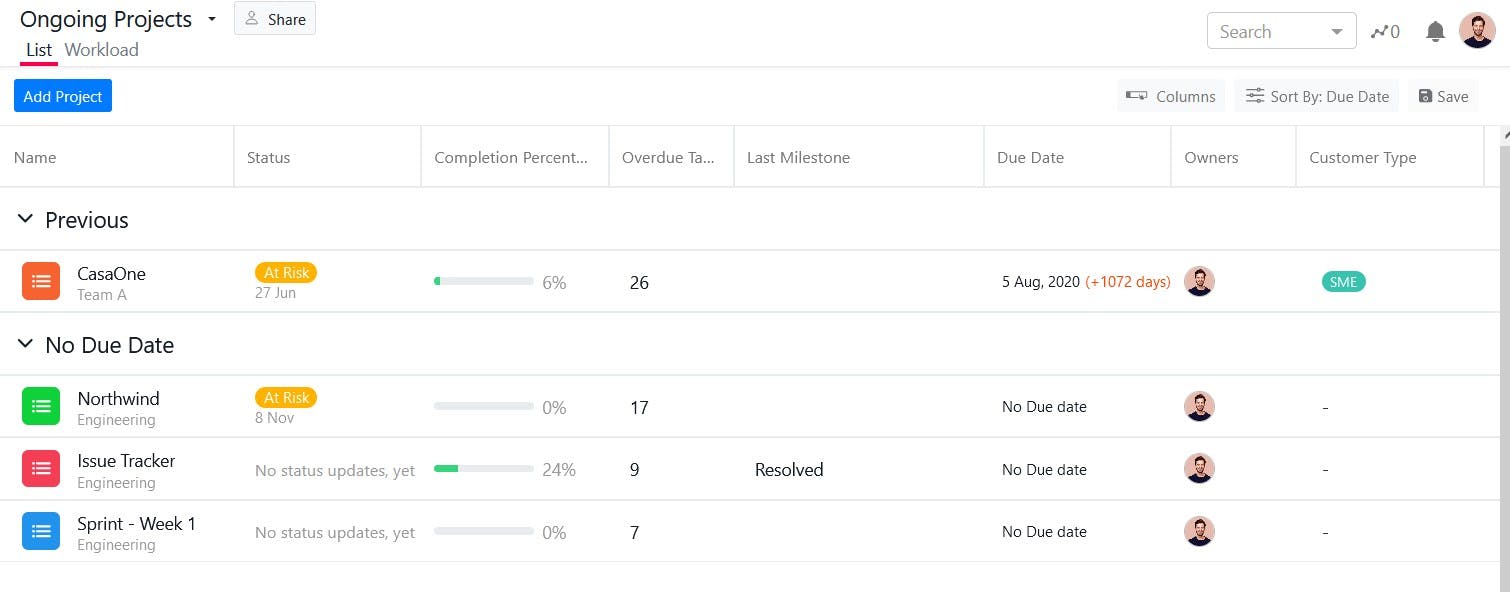
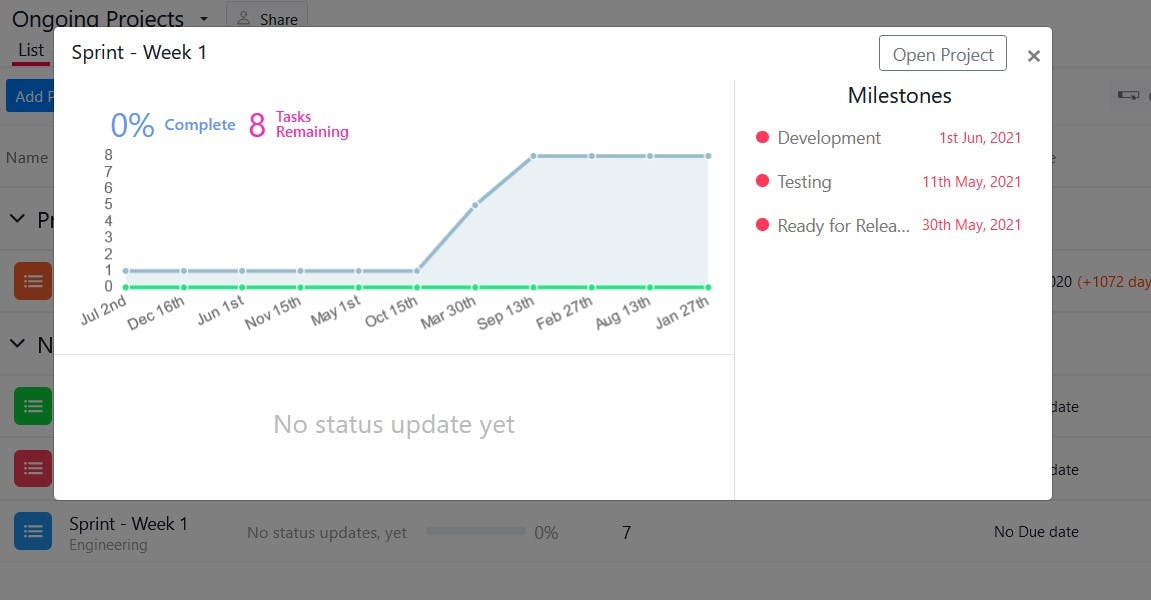
This project dashboard is suitable for IT developers and software engineering teams to manage their agile projects. You can track multiple sprints and other related projects together in one place.
You can also track typical milestones in sprints such as Development, Testing, and Release as shown in the image below.
2. Warehouse Project Management Dashboard
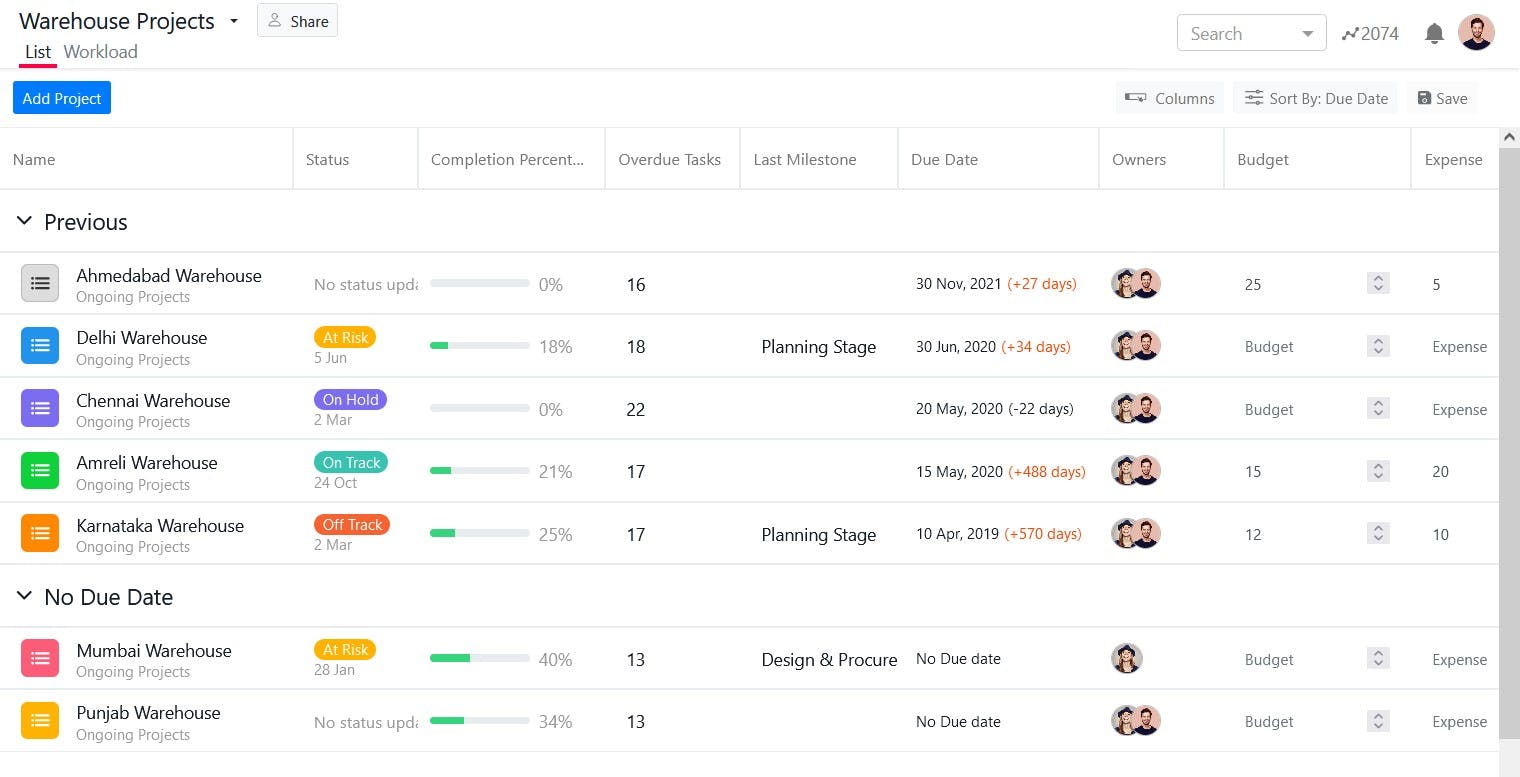
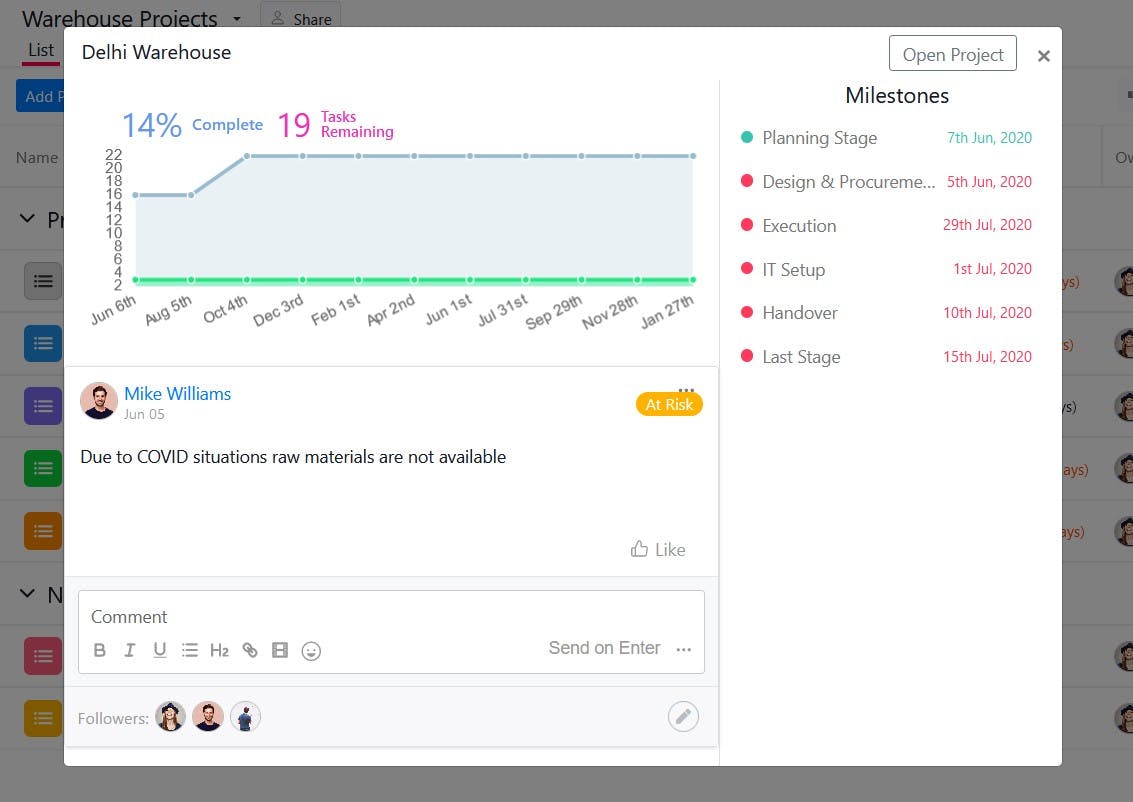
This dashboard allows you to manage and track warehouse implementations across multiple locations. It is suitable for e-commerce businesses, manufacturers, importers, exporters, wholesalers, transport businesses, customs, etc.
You can set and track various installation stages aka milestones such as Planning, Design, Procurement, Execution, and so on as shown in the image below.
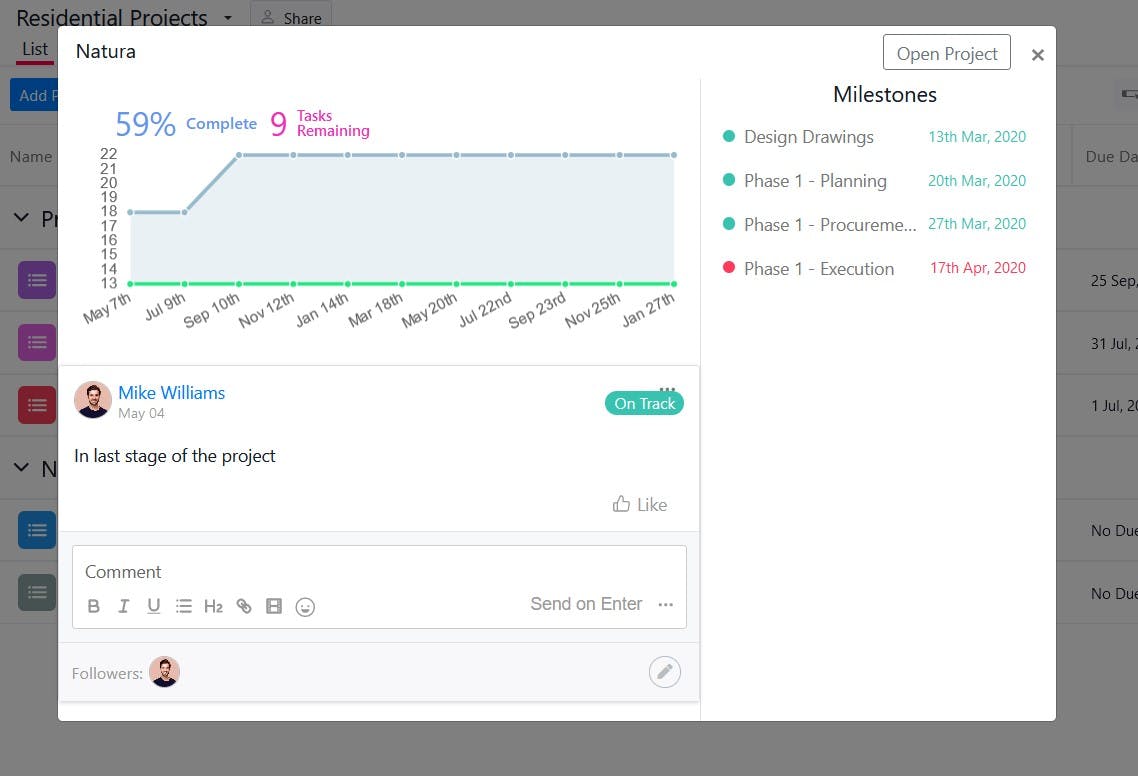
3. Construction Project Management Dashboard
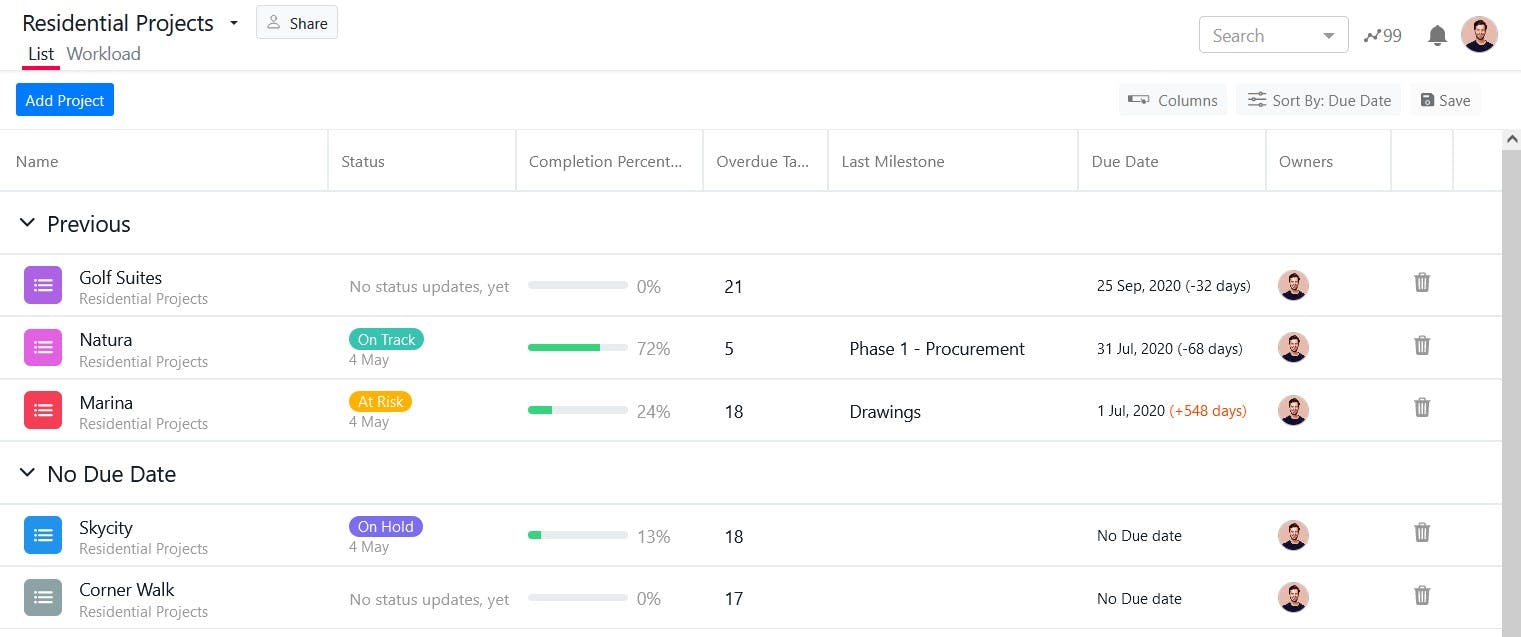
This dashboard allows you to keep track of your construction projects. It is suitable for real estate and architectural projects.
You can track different project phases such as Design, Planning, Procurement, and Execution as shown in the image below.
4. Research & Development Project Management Dashboard
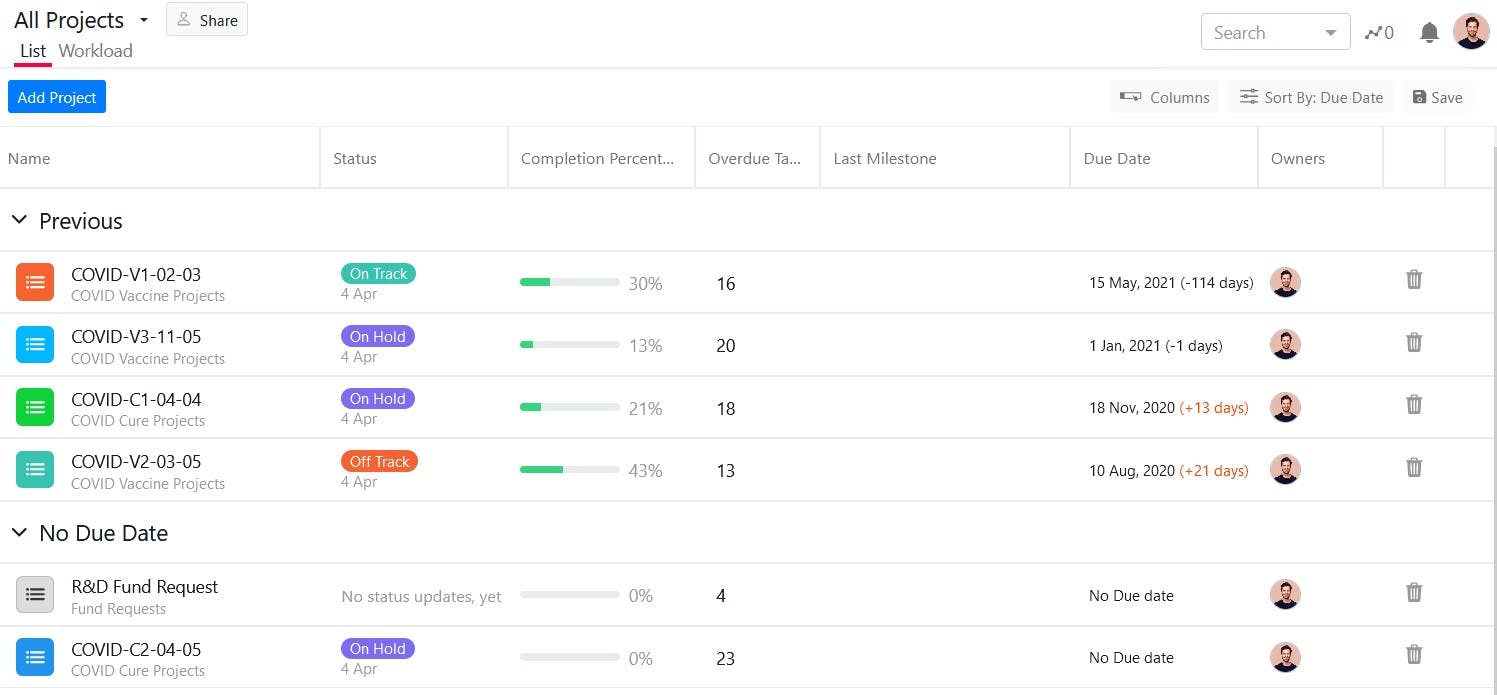
This type of dashboard allows you to keep track of research & development projects. It is suitable for healthcare, life sciences, and R&D firms.
These were some of the real-life examples of how dashboards look like in SmartTask. But, the things you can do with the SmartTask are only limited by your imagination.
SmartTask also offers ready-made templates for marketing, operations, engineering, accounts, and human resource teams. You can set up all your projects in seconds with these ready-to-use templates.
Now, let’s talk about what features you should look for in an ideal project management dashboard.
What features should you look for in a Dashboard for Project Management?
Here are some of the feature characteristics you should look for in a project management dashboard:
1. Real-time updates
When you are using dashboards in project management software, it should be continuously able to pull real-time updates as teams complete their tasks in the project. Real-time updates allow dashboards to display the latest status of projects all the time.
2. Customization
A customizable dashboard allows you to connect and integrate with the platform and services your team already uses. You shouldn’t stop using those services for the project management dashboard. In fact, it should easily integrate with your key services and applications.
3. Shareability
You should be able to share the project’s progress with your team members, executives, and external stakeholders with an ideal project dashboard.
We have already discussed how easy it is to share your project’s status with SmartTask portfolios.
4. User-friendliness
A user-friendly dashboard helps you easily navigate through different components and widgets of a dashboard. You should enjoy working with the dashboard, especially when you are going to use it daily. It should also be visually appealing to you.
5. Scannability
Scannability means you should be able to interpret the information available on the dashboard in seconds when you need it. A scannable dashboard enables you to spot issues and opportunities quickly and helps you make intelligent decisions.
Benefits of Project Management Dashboards
1. Streamlines all projects in one place
A project dashboard allows you to centralize all your projects at one location. You can track the progress, status, milestones, analytics, overdue tasks, and due dates for multiple projects.
This centralized approach helps you quickly access all the important insights and metrics rather than wasting your time navigating complicated spreadsheets and reporting tools.
2. Utilizes real-time data
A project dashboard updates automatically as the team members complete tasks and hit the milestones. This way, you will always get the real-time status of all the projects. It also helps teams to stay on track and deliver projects under deadlines.
3. Generates actionable insights
The project dashboards are mainly used to generate actionable insights that allow you to make intelligent decisions as quickly as possible. You can interpret what’s working, what’s not working, and act accordingly.
4. Encourages collaboration
Projects usually involve multiple stages on which various teams work together. Often, one stage depends on another, which means one team cannot start their tasks until the other team finishes theirs.
That’s where the dashboard plays an important role. It informs teams about the status of stages, aka milestones, and keeps everyone in the loop regarding the project’s progress. It also aligns teams and helps them focus on the shared goals.
5. Enhances communication
A dashboard allows you to share the project’s progress with other teammates as well as key stakeholders, ultimately enhancing communication.
6. Balances the workload
A project dashboard helps you track the workload of each team member. As a result, you can allocate tasks based on the capabilities of team members and utilize resources effectively. It also helps you ensure that tasks are properly distributed and nobody is overburdened or underutilized.
Bottom Line: Project dashboards can help you in many ways, from monitoring your projects from one place to making intelligent data-driven decisions by keeping your teams in the loop all the time. SmartTask allows you to create custom project dashboards the way you want so that you can monitor your projects with ease.
Want to know more about project dashboards - Get a free consulation today


FAQs
1. Why is a project dashboard important?
A project management dashboard is a data dashboard designed to display metrics, stats, insights, and key performance indicators related to specific projects at one central location. It gives you a big picture of how your projects are doing and makes your project management smoother and more efficient.
2. What is a KPI dashboard?
KPI dashboards are tools that pull data from multiple sources and present it in a single interface where you can view at a glance how your projects are doing against your key performance indicators (KPIs). They help you manage multiple projects, monitor the performance of projects, and make intelligent decisions.
3. What should a project dashboard show?
An ideal project dashboard should have the following elements:
- Project Status
- Task Status
- Milestone Status
- Workload Status
- Due Dates
- Owner/Team Member Responsible


